Yukon River 2002 Data Analysis
Map of Yukon River drainage
Sampling site: between the Dalton Highway Bridge and the USGS Stevens Village hydrological station

Daily Discharge and Sampling Date

Monthly integrated discharge

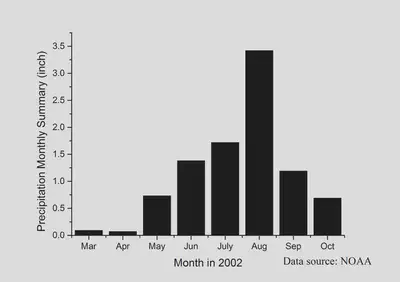
Precipitation
Three fluorescence components by PARAFAC Analysis-revised
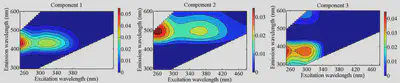
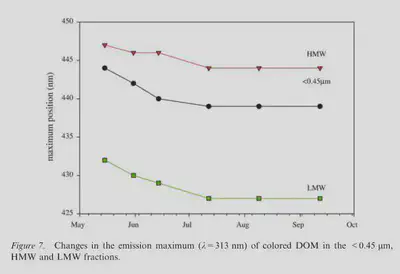
Excitation and emission maximum
| Components | Ex max (nm) | Em max (nm) | Property |
|---|---|---|---|
| C1 | 240/315 | 432 | Humic-like |
| C2 | 260/365 | 494 | Humic-like |
| C3 | <240/295 | 374 | Humic-like |
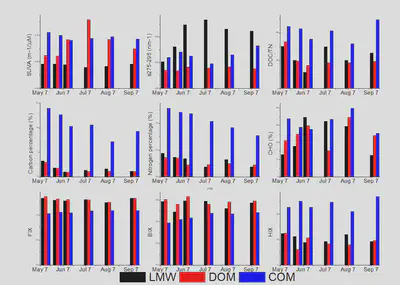
LMW-DOM-COM
Fluorescence components ratios

Normalized PARAFAC components-DOM
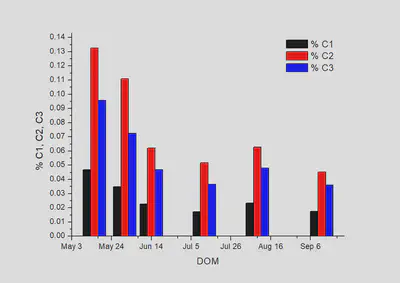
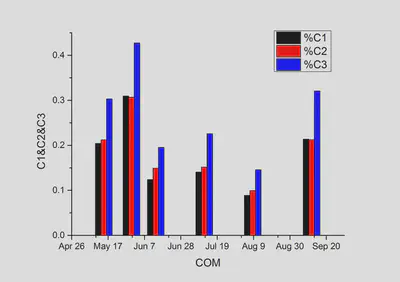
Normalized PARAFAC components-COM
Normalized PARAFAC components-LMW
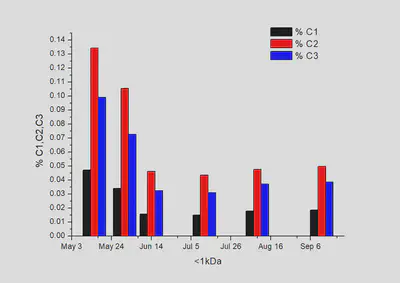
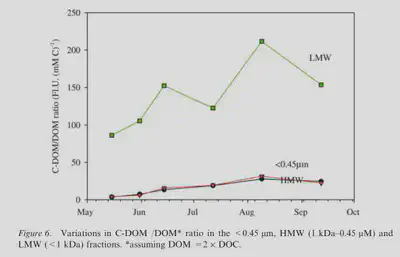
Figure 6 from Guo et al.

S275-295 vs %C1, C2, C3
Hydrodynamic diameters distribution of colloids in the Yukon River upper stream in 2002.
UV1
 UV1 Yukon 01 COM.jpg)
UV2
 UV2 Yukon 01 COM.jpg)
Fluorescence 1 -
 FLD1 Yukon 01 COM.jpg)
Fluorescence 2 -
 FLD2 Yukon 01 COM.jpg)
size distribution (molecular weights)
UV1
 UV1 Yukon 01 COM.jpg)
UV2
 UV2 Yukon 01 COM.jpg)
Fluorescence 1 (Ex/Em = 350 nm /450 nm)
 FLD1 Yukon 01 COM.jpg)
Fluorescence 2 (Ex/Em = 275 nm/ 340 nm)
 FLD2 Yukon 01 COM.jpg)
Integrations of each size intervals - Size distribution of colloidal organic matter
UV1

UV2

Fluorescence 1 (Ex/Em = 350 nm /450 nm)

Fluorescence 2 (Ex/Em = 275 nm/ 340 nm)

Integrations of size intervals - size distribution of colloids in molecular weights
UV1

UV2

Fluorescence 1 (Ex/Em = 350 nm /450 nm)

Fluorescence 2 (Ex/Em = 275 nm/ 340 nm)

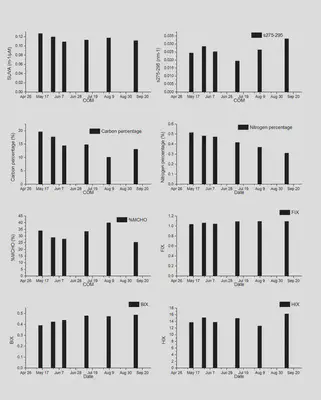
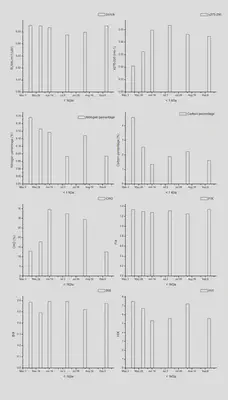
Total data
| Sample_Name | a254 | SUVA | S275-295 | TOC | TN | DOC/TN | Weight | Carbon percentage | Nitrogen percentage | MCHO | %MCHO |
|---|---|---|---|---|---|---|---|---|---|---|---|
| m-1 | m-1/uM | nm-1 | (uM) | (uM) | mg | % | % | (uM-C) | % | ||
| YR_<1kDa1 | 6.35 | 0.06 | 0.021 | 114.68 | 3.8 | 30.2 | 3.01 | 4.57 | 0.18 | 14.85 | 12.95 |
| YR_<1kDa2 | 4.19 | 0.05 | 0.032 | 76.36 | 3.77 | 20.25 | 3.62 | 2.53 | 0.15 | 13.64 | 17.86 |
| YR_<1kDa3 | 2.04 | 0.05 | 0.05 | 38.03 | 3.29 | 11.55 | 3.36 | 1.36 | 0.14 | 13.18 | 34.65 |
| YR_<1kDa4 | 2.3 | 0.05 | 0.053 | 48.39 | 1.62 | 29.94 | 3.08 | 1.89 | 0.07 | 15.66 | 32.36 |
| YR_<1kDa5 | 2.86 | 0.05 | 0.046 | 57.51 | 2.85 | 20.19 | 3.11 | 2.22 | 0.13 | 16.89 | 29.37 |
| YR_<1kDa6 | 2.75 | 0.06 | 0.045 | 50.03 | 1.97 | 25.45 | 3.71 | 1.62 | 0.07 | 6.29 | 12.57 |
| YR_DOM1 | 7.61 | 0.07 | 0.014 | 101.64 | 3.03 | 33.53 | 2.95 | 4.13 | 0.14 | 21.43 | 21.08 |
| YR_DOM2 | 4.77 | 0.07 | 0.014 | 65.01 | 3.28 | 19.79 | 3.24 | 2.41 | 0.14 | 16.03 | 24.65 |
| YR_DOM3 | 4.61 | 0.11 | 0.017 | 41.94 | 2.53 | 16.55 | 3.96 | 1.27 | 0.09 | 12.53 | 29.87 |
| YR_DOM4 | 5.91 | 0.15 | 0.016 | 38.22 | 2.08 | 18.42 | 3.16 | 1.45 | 0.09 | 5.8 | 15.18 |
| YR_DOM5 | 5.27 | 0.11 | 0.017 | 47.44 | 2.56 | 18.51 | 3.62 | 1.57 | 0.1 | 16.39 | 34.55 |
| YR_DOM6 | 3.36 | 0.09 | 0.015 | 37.38 | 1.92 | 19.47 | 2.98 | 1.51 | 0.09 | 8.98 | 24.01 |
| YR_COM1 | 39.53 | 0.13 | 0.024 | 311.89 | 7.01 | 44.5 | 1.91 | 19.6 | 0.51 | 105.83 | 33.93 |
| YR_COM2 | 58.46 | 0.12 | 0.028 | 490.13 | 11.44 | 42.83 | 3.32 | 17.72 | 0.48 | 141.08 | 28.78 |
| YR_COM3 | 21.76 | 0.11 | 0.025 | 200.24 | 5.63 | 35.57 | 1.67 | 14.39 | 0.47 | 55.48 | 27.71 |
| YR_COM4 | 24.83 | 0.11 | 0.019 | 220.32 | 5.31 | 41.46 | 1.79 | 14.77 | 0.42 | 73.61 | 33.41 |
| YR_COM5 | 16.23 | 0.12 | 0.026 | 138.85 | 4.33 | 32.03 | 1.65 | 10.1 | 0.37 | 55.44 | 39.92 |
| YR_COM6 | 35.58 | 0.11 | 0.033 | 320.39 | 6.5 | 49.29 | 2.95 | 13.03 | 0.31 | 81.23 | 25.35 |
| Sample_Name | FIX | BIX | HIX | %FIX | %BIX | %HIX | C1 | C2 | C3 | %C1 | %C2 | %C3 |
|---|---|---|---|---|---|---|---|---|---|---|---|---|
| YR_<1kDa1 | 1.34 | 0.59 | 7.51 | 0.01 | 0.01 | 0.07 | 5.421 | 15.402 | 11.369 | 0.047 | 0.134 | 0.099 |
| YR_<1kDa2 | 1.3 | 0.49 | 6.75 | 0.02 | 0.01 | 0.09 | 3.912 | 12.088 | 8.324 | 0.034 | 0.105 | 0.073 |
| YR_<1kDa3 | 1.28 | 0.59 | 5.33 | 0.03 | 0.02 | 0.14 | 1.818 | 5.289 | 3.717 | 0.016 | 0.046 | 0.032 |
| YR_<1kDa4 | 1.31 | 0.59 | 5.58 | 0.03 | 0.01 | 0.12 | 1.734 | 4.999 | 3.566 | 0.015 | 0.044 | 0.031 |
| YR_<1kDa5 | 1.25 | 0.52 | 7.22 | 0.02 | 0.01 | 0.13 | 2.06 | 5.472 | 4.263 | 0.018 | 0.048 | 0.037 |
| YR_<1kDa6 | 1.34 | 0.58 | 5.58 | 0.03 | 0.01 | 0.11 | 2.135 | 5.725 | 4.414 | 0.019 | 0.05 | 0.038 |
| YR_DOM1 | 1.37 | 0.61 | 7.58 | 0.01 | 0.01 | 0.07 | 5.353 | 15.205 | 10.979 | 0.047 | 0.133 | 0.096 |
| YR_DOM2 | 1.32 | 0.56 | 3.69 | 0.02 | 0.01 | 0.06 | 3.997 | 12.736 | 8.304 | 0.035 | 0.111 | 0.072 |
| YR_DOM3 | 1.31 | 0.63 | 6.48 | 0.03 | 0.02 | 0.15 | 2.586 | 7.11 | 5.365 | 0.023 | 0.062 | 0.047 |
| YR_DOM4 | 1.3 | 0.56 | 5.04 | 0.03 | 0.01 | 0.13 | 1.979 | 5.927 | 4.173 | 0.017 | 0.052 | 0.036 |
| YR_DOM5 | 1.26 | 0.58 | 4.81 | 0.03 | 0.01 | 0.1 | 2.683 | 7.211 | 5.505 | 0.023 | 0.063 | 0.048 |
| YR_DOM6 | 1.34 | 0.59 | 5.82 | 0.04 | 0.02 | 0.16 | 1.993 | 5.181 | 4.126 | 0.017 | 0.045 | 0.036 |
| YR_COM1 | 1.03 | 0.39 | 13.66 | 0 | 0 | 0.04 | 23.412 | 24.319 | 34.765 | 0.204 | 0.212 | 0.303 |
| YR_COM2 | 1.06 | 0.42 | 15.09 | 0 | 0 | 0.03 | 35.498 | 35.186 | 49.029 | 0.31 | 0.307 | 0.428 |
| YR_COM3 | 1.04 | 0.44 | 13.72 | 0.01 | 0 | 0.07 | 14.185 | 17.107 | 22.409 | 0.124 | 0.149 | 0.195 |
| YR_COM4 | 1.09 | 0.48 | 14.91 | 0 | 0 | 0.07 | 16.139 | 17.396 | 25.885 | 0.141 | 0.152 | 0.226 |
| YR_COM5 | 1.09 | 0.47 | 12.62 | 0.01 | 0 | 0.09 | 10.179 | 11.375 | 16.713 | 0.089 | 0.099 | 0.146 |
| YR_COM6 | 1.09 | 0.49 | 16.2 | 0 | 0 | 0.05 | 24.492 | 24.344 | 36.793 | 0.214 | 0.212 | 0.321 |
Figures from literatures
  
DOC&CHO Concentration
 
DOC HMW & LMW

Variations of dissolved organic carbon in the HMW (1kDa–0.45 um) and the LMW (<1kDa) fractions
CHO MCHO&TCHO

Concentrations of carbohydrate species, including monosaccharides (MCHO) and polysaccharides (PCHO), in the <0.45 um DOM fraction.
Comparison of HMW and LMW
Comparison btw/ Fig 2 from Zou et al. and Fig 4 from Guo et al.
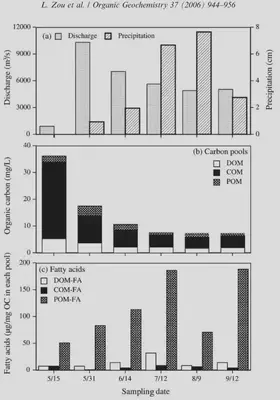
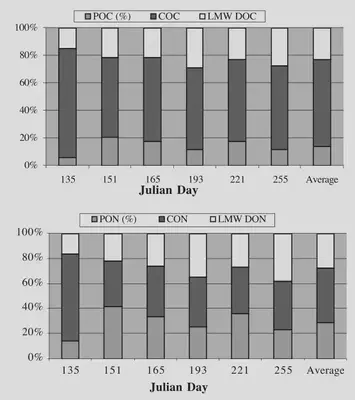
Fig 4 from Zou et al.
Fig 5 from Zou et al.
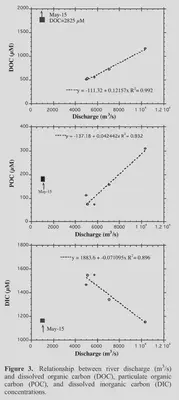
DOC POC DIC
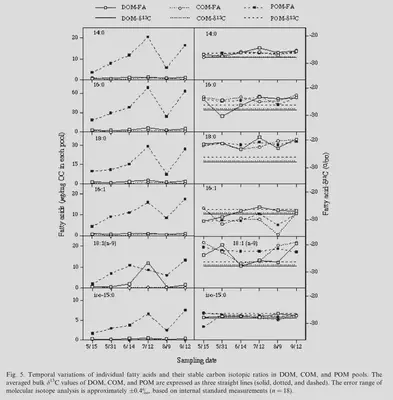
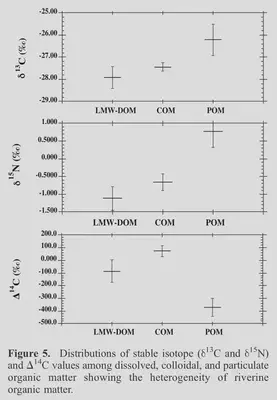
Isotope Information

Isotope source difference
Dr. Hui Lin (林辉)
Assistant Researcher
My research interests include Dissolved Organic Matter (DOM) in natural waters, marine chemistry using isotope methodology and freshwater sciences.