Learning ggmap
This is a document for myself to review ggmap package, and how to get quick start.
ggmap is powerful map plot package in R. Compared with maps package, plots exported from ggmaps are elegant.
Two steps to plot a map: plot a map raster, decorate the base map with your own data.
Step 1: download your base map
You need to know the location you will plot. Define location in two ways showing below:
library(ggmap)
Location1 <- "University of Wisconsin, Milwaukee" #Use your address as your defination
Location2 <- "c(lon = -95.3632715, lat = 29.7632836)" # Use longitude and latitude
Use get_map function to download the raster map in your location.
There are 3 map “sources” to obtain a map raster, and each of these sources has multiple “map types”
stamen: “watercolor”, “toner”, “terrain”

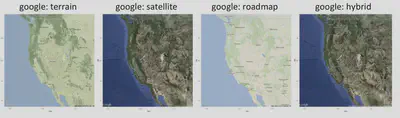
googlemap:
osm:(sometimes their servers are unavailable)

myMap <- get_map(location=myLocation, source="stamen", maptype=“watercolor", crop=FALSE)
ggmap(myMap)
##zoom = integer from 3-21
##3 = continent, 10=city, 21=building
##(openstreetmap limit of 18)
Step 2 decorate your map with data
In addition, a developing R package need to be concerned: rMap.
References:
[ggmap Introduction](https://dl.dropboxusercontent.com/u/24648660/ggmap useR 2012.pdf)
Dr. Hui Lin (林辉)
Assistant Researcher
My research interests include Dissolved Organic Matter (DOM) in natural waters, marine chemistry using isotope methodology and freshwater sciences.